译文
Unity UI Profiling Tools
Unity UI性能分析工具
版本检查: 2017.3
难度: 高级
There are several profiling tools useful for analyzing Unity UI’s performance. The key tools are:
有几种分析工具可用于分析Unity UI的性能。主要的工具有:
● Unity Profiler
● Unity Frame Debugger
● Xcode’s Instruments or Intel VTune
● Xcode’s Frame Debugger or Intel GPA
The external tools provide method-level CPU profiling with millisecond (or better) resolution, as well as detailed draw-call and shader profiling. Instructions for setting up and using the above tools lie beyond the scope of this guide. Note that the XCode Frame Debugger and Instruments are only usable on IL2CPP builds for Apple platforms, and therefore can currently only be used to profile iOS builds.
这些外部工具用了毫秒级(或更高)的分辨率来给CPU提供方法级的分析,并且还有很细节的绘制调用及着色器分析。设置和使用这些工具的说明不在本指南范围。注意Xcode Frame Debugger 和 Instruments 仅适用于苹果系统的IL2CPP,因此目前只能用于配置iOS版本。
Unity Profiler
The primary use for the Unity Profiler is to perform comparative profiling: enabling and disabling elements of a UI while the Unity Profiler is running can quickly narrow down the portions of a UI hierarchy that are most responsible for performance issues.
Unity Profiler的主要用途是比较分析性能:在Unity Profiler运行时启用和禁用UI元素可以快速缩小影响性能的UI层次结构的部分。
To analyze this, watch the Canvas.BuildBatch and Canvas.SendWillRenderCanvases lines in the profiler’s output.
要分析这一点,请在分析器的输出中观察Canvas.BuildBatch和Canvas.SendWillRenderCanvases。
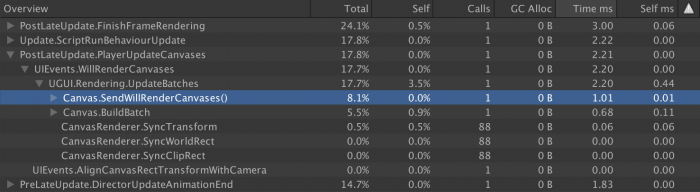
Canvas.BuildBatch is the native-code calculations that perform the Canvas Batch Building process, as described previously.
Canvas.BuildBatch是执行Canvas Batch Building过程的本机代码计算,如前所述。
Canvas.SendWillRenderCanvases contains the invocation of the C# scripts that are subscribed to the Canvas component’s willRenderCanvases Event. Unity UI’s CanvasUpdateRegistry class receives this event and uses it to run the Rebuild process, described previously. It is expected that any dirty UI components will update their Canvas Renderers at this time.
Canvas.SendWillRenderCanvases包含了Canvas组件的willRenderCanvases事件的C#脚本的调用。Unity UI的CanvasUpdateRegistry类接收这个事件并使用它来运行重建过程,如前所述。预计每一个被标记为dirty的UI组件都会在这个时候更新它们的Canvas Renderer。
Note: To more easily see differences in UI performance, it is generally advisable to disable all of the trace categories aside from “Rendering”, “Scripts” and “UI”. This can be done by clicking on the colored boxes beside the name of the trace category on the left-hand side of the CPU Usage profiler. The categories can also be re-ordered in the CPU profiler by clicking and dragging the names of the categories upwards or downwards.
注意:为了更容易地看到UI性能的差异,通常建议禁用除“渲染”,“脚本”和“UI”之外的所有跟踪类别。这可以通过点击CPU占用率探查器(CPU Usage profiler)左侧的跟踪类别旁边的彩色框来完成。通过单击并向上或向下拖动类别的名称,也可以在CPU分析器中重新排序类别。
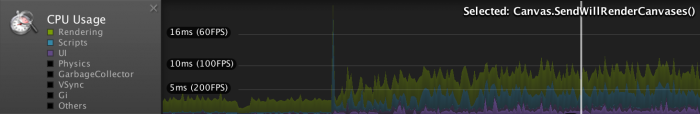
The UI category is new in Unity 2017.1 and up. Unfortunately, parts of the UI update process are not categorized correctly, so be careful when looking at the UI curve because it may not contain all UI related calls. For example, Canvas.SendWillRenderCanvases is categorized as "UI", but Canvas.BuildBatch is categorized as “Others” and “Rendering”.
UI类别是Unity 2017.1及更高版本中的新功能。遗憾的是,部分UI更新过程未正确分类,因此在查看UI曲线时要小心,因为它可能不包含所有与UI相关的调用。例如,Canvas.SendWillRenderCanvases被归类为“UI”,但Canvas.BuildBatch被归类为“其他”和“渲染”。
In 2017.1 and up, there’s also a new UI Profiler. By default, this profiler is the last one in the Profiler window. It consists of two timelines and a batch viewer:
在2017.1及更高版本中,还有一个新的UI Profiler。默认情况下,此探查器是Profiler窗口中的最后一个。它由两个时间轴和一个批处理查看器组成:
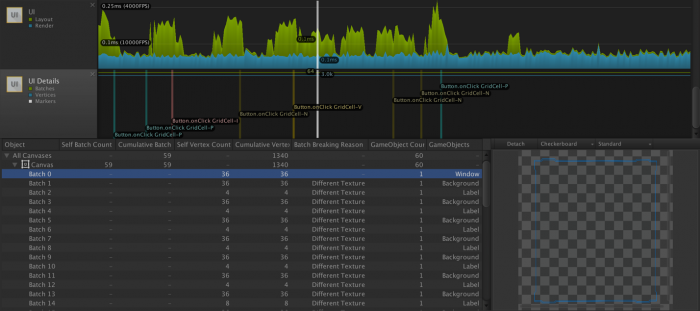
The first timeline shows the CPU time spent in two categories, respectively computing layout and rendering. Note that it suffers from the same problem described previously and some UI functions may not be accounted for.
第一个时间轴显示了两个类别的CPU时间,分别是计算布局和渲染。请注意,它遇到了前面描述的相同问题,并且可能无法考虑某些UI功能。
The second timeline shows the total number of batches, vertices and also displays event markers. In the previous screenshot, you can see a couple of button click events. These markers can help you determine what caused a CPU spike.
第二个时间轴显示批次,顶点的总数,还显示事件标记。在上一个屏幕截图中,可以看到几个按钮单击事件。这些标记可以帮助你确定导致CPU峰值的原因。
Finally, the most useful feature of the UI Profiler is the batch viewer at the bottom. On the left, there’s a tree view of all your canvases and underneath each of them, a list of the batches they generated. The columns provide interesting details about each canvas or batch, but there’s one in particular that is crucial to better understand how to optimize your UI and it’s the Batch Breaking Reason.
最后,UI Profiler最有用的功能是底部的批处理查看器。在左侧,可以看到所有画布的树形视图,并在每个画布的下方列出了它们生成的批次。这些列提供了有关每个画布或批处理的详细信息,但是有一个特别关键的是要更好地理解如何优化UI以及批处理中断原因。
This column will show why the selected batch couldn’t be merged with the previous one. Reducing the number of batches is one of the most effective way of improving UI performance, so it’s important to understand what breaks batching.
此列将显示无法将所选批次与前一批合并的原因。减少批量数量是提高UI性能的最有效方法之一,因此了解哪些中断批处理非常重要。
One of the most frequent reason, as shown in the screenshot, is a UI element using a different texture or material. In many cases, this can easily be fixed by using sprite atlases. The last column shows the name of the game objects associated with the batch. You can double click on the name to select the game object in the editor (this is particularly helpful when you have several objects with the same name).
如屏幕截图所示,最常见的原因之一是使用不同纹理或材质的UI元素。在许多情况下,这可以通过使用精灵图集轻松修复。最后一列显示与批次关联的游戏对象的名称。你可以双击名称以在编辑器中选中游戏对象(当有多个具有相同名称的对象时,这个尤其有用)。
As of Unity 2017.3, the batch viewer only works in the editor. The batching should usually be the same on device, so this is still really helpful. If you have doubt that batches may be different on device, then you can use the Frame Debugger that will be described next.
从Unity 2017.3开始,批处理查看器仅在编辑器中使用。批量在设备上通常应该是相同的,所以这是非常有用的。如果你怀疑设备上的批次可能不同,那么你可以使用下面将描述的帧调试器。
Unity Frame Debugger
Unity帧调试器
The Unity Frame Debugger is a useful tool for reducing the number of draw calls generated by a Unity UI. This built-in tool can be accessed via the Window menu within the Unity Editor. When enabled, it will display all draw calls generated by Unity, including those generated by Unity UI.
Unity Frame Debugger对减少Unity UI产生的draw calls数量很有用。这个内置的工具可以通过Unity 编辑器中Window菜单进入。当启用后,它会显示Unity 产生的所有的draw calls,包括Unity UI生成的draw calls。
Notably, the frame debugger will update itself with the draw calls generated to display the Game View in the Unity Editor, and therefore can be used to try out different UI configurations without even entering Play Mode.
值得注意的是,帧调试器将会根据Unity Editor模式下Game视图所产生的draw calls来不断的更新自身,因此可以在不进入游戏模式的情况下来尝试不同的UI配置。
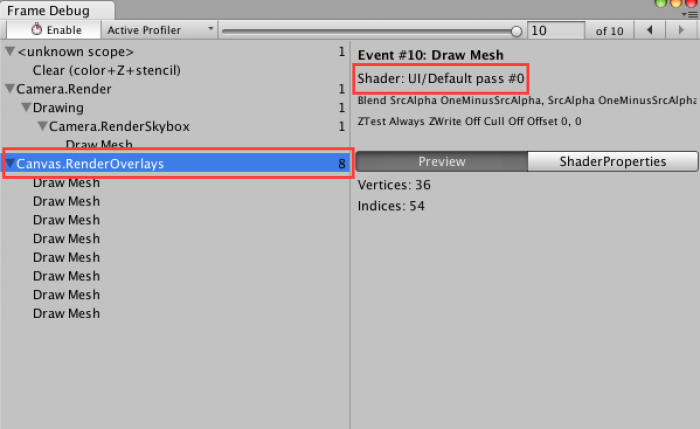
The location of the Unity UI draw calls depends on the Render Mode selected on the Canvas component being drawn:
Unity UI draw calls的位置取决于在绘制的Canvas组件上选择的渲染模式:
● Screen Space – Overlay will appear within Canvas.RenderOverlays group
Screen Space – Overlay ,将出现在Canvas.RenderOverlays组中。
● Screen Space – Camera will appear within the Camera.Render group of the selected Render Camera, as a subgroup of Render.TransparentGeometry
Screen Space – Camera,将显示在所选渲染相机的Camera.Render组内,作为Render.TransparentGeometry的子组
● World Space will appear as a subgroup of Render.TransparentGeometry for each World Space camera in which the Canvas is visible
World Space,将显示在Render. TransparentGeometry的一个子组出现在任何一个世界空间下可见的Canvas上。
All UIs can be identified by the “Shader: UI/Default” line (assuming that the UI shader has not been replaced with a custom shader). in the group or draw call’s details. See the highlighted red boxes in the below screenshot.
所有的UI都可以通过组中"Shader:UI/Default"(前提是没有更换Shader)或者draw call细节来确定。详情见下图中的红色部分:
By watching this set of lines while tweaking a UI, it is relatively simple to maximize the Canvas’ ability to combine UI elements into batches. The most common design-related cause of broken batches is unintentional overlap.
调整UI时通过观察这组线条,最大化的发挥Canvas将UI元素组合成批次的能力是相对简单的。在设计的时候最容易引发broken batches(批次破坏)的原因是无意的重叠UI元素。
All Unity UI components generate their geometry as a series of quads. However, many UI sprites or UI text glyphs occupy only a fraction of the quads used to represent them, with the rest being empty space. As a result, it is quite common to find that the UI’s designer has unintentionally overlapped multiple different quads whose textures come from different materials and therefore cannot be batched.
所有Unity UI组件都将其几何图形生成为一系列四边形。然而,很多UI 精灵(Sprites)或UI 文本(Text)仅占了四边形的一部分来表示它们,剩下的都是空白的空间。因此,很常见的是,UI的设计者无意中重叠了多个不同的四边形,这些四边形的纹理来自不同的材质,因此无法进行批处理。
As Unity UI operates entirely in the transparent queue, any quads that have unbatchable quads overlaid atop them must be drawn before the unbatchable quads, and therefore cannot be batched with other quads placed atop the unbatchable quads.
由于Unity UI完全在透明队列中运行,因此被任何没有批处理的四边形覆盖的四边形都必须要在没有批处理的四边形之前绘制,因此不能和放置在没有批处理四边形上的其他四边形进行批处理。(已然懵逼,跟个绕口令似的~)
Consider a case of three quads, A, B, and C. Assume all three quads overlap one another, and also assume quads A and C use the same material while quad B uses a separate material. Quad B therefore cannot be batched with A or C.
考虑三个四边形(A,B和C)的情况。假设三个四边形彼此重叠,并且还假设四边形A和C使用相同的材材质,而四边形B使用单独的材质。因此,四边形B不能与A或C一起批量生产。
If the order in the hierarchy (from top to bottom) is A, B, C then A and C cannot be batched, because B must be drawn atop A and beneath C. However, if B is placed before or after the batchable quads, then the batchable quads can actually be batched – B needs only to be drawn before or after the batched quads and does not interpose them.
如果层次结构中的顺序(从上到下)是A,B,C,则A和C不能进行批处理,因为B必须在A之前和C之后绘制。但是,如果B放置在成批次的A和C之前或者之后,那么成批次的A和C就可以进行批处理,B只需要在A和C之前或者之后绘制出来并且不介入它们就可以。
For further discussion of this issue, see the Child order section of the Canvas chapter.
对于这个问题进一步的讨论,可以看Canvas章节中Child order部分。
Instruments & VTune
Xcode’s Instruments and Intel’s VTune allow for extremely deep profiling of Unity UI rebuilds and Canvas batch calculations on Apple or Intel CPUs, respectively. The method names are nearly identical to the profiler labels discussed above in the Unity Profiler section:
Xcode的Instruments和Intel的VTune允许分别对Apple或Intel CPU上的Unity UI重建和Canvas批量计算进行极为深入的分析。方法名称几乎与Unity Profiler部分中讨论的分析器标签相同:
● Canvas::SendWillRenderCanvases is the C++ parent that calls the Canvas.SendWillRenderCanvases C# method and governs that line in the Unity Profiler. It will contain the code used to run the Rebuild process, as described in the previous chapter.
Canvas::SendWillRenderCanvases是调用Canvas.SendWillRenderCanvases C#方法并控制Unity Profiler中该行的C ++父类。它将包含用于运行重建过程的代码,如上一章所述。
● Canvas::UpdateBatches is identical to Canvas.BuildBatch, but includes additional boilerplate code not covered by the Unity Profiler label. It runs the actual Canvas Batch Building process, described above.
Canvas::UpdateBatches 等同于Canvas.BuildBatch,但包括Unity Profiler没有涉及到的额外的样板代码。它运行实际的Canvas Batch Building过程,如上所述。
When used in conjunction with a Unity app built via IL2CPP, these tools can be used to drill down deeper into the transpiled C# code of Canvas::SendWillRenderCanvases. Of primary interest will be the cost of the following methods. (Note: transpiled method names are approximate.)
当与通过IL2CPP编译的UnityApp结合使用时,这些工具可用于深入研究Canvas :: SendWillRenderCanvases的已转换C#代码。主要关注的是以下方法的成本。(注意:被编译的方法名称相似。)
● IndexedSet_Sort and CanvasUpdateRegistry_SortLayoutList are used to sort the list of dirty Layout components before the layouts are recalculated. As described above, this involves calculating the number of parent transforms above each Layout component.
IndexedSet_Sort和CanvasUpdateRegistry_SortLayoutList用于在重新计算布局之前对标记为dirty的布局组件列表进行排序。如上所述,这涉及计算每个布局组件的父物体的数量。
● ClipperRegistry_Cull calls all registered implementers of the IClipRegion interface. Built-in implementers include RectMask2D, which uses the IClippable interface. During ClipperRegistry.Cull calls, RectMask2D components loop over all clippable elements contained within their hierarchy and asks them to update their culling information.
ClipperRegistry_Cull调用IClipRegion接口的所有已注册实现类。内部实现包括RectMask2D,它使用IClippable接口。在ClipperRegistry.Cull调用期间,RectMask2D组件遍历其层次结构中包含的所有可剪切元素,并要求它们更新其剔除信息。
● Graphic_Rebuild will contain the cost of actually calculating the meshes needed to represent Image, Text or other Graphic-derived components. Beneath this will be several other methods like Graphic_UpdateGeometry and, most notably, Text_OnPopulateMesh.
Graphic_Rebuild将包含实际计算表示图像,文本或其他图形派生组件所需的网格的成本。在其下面将是几个其他方法,如Graphic_UpdateGeometry,最重要的是Text_OnPopulateMesh。
- Text_OnPopulateMesh is generally a hotspot when Best Fit is enabled. This is discussed in more detail later in this guide.
Text_OnPopulateMesh ,当Best Fit启动后,通常是一个热点。这将在后面详细讨论。
- Mesh modifiers, such as Shadow_ModifyMesh and Outline_ModifyMesh, will also run here. The cost of calculating component drop shadows, outlines and other special effects can be seen via these methods.
网格修改器,例如Shadow_ModifyMesh和Outline_ModifyMesh,也将在这里运行。通过这些方法可以看出计算组件阴影,轮廓和其他特殊效果的成本。
Xcode Frame Debugger & Intel GPA
Low-level frame debugging tools are essential for profiling the cost of individual portions of the batched UI as well as monitoring the cost of UI overdraw. UI overdraw is discussed in more detail later in this guide.
低级框架调试工具对于分析批量UI的各个部分的成本以及监控UI透支的成本至关重要。UI过度绘制将在本指南后面详细讨论。
Using the Xcode Frame Debugger
使用Xcode帧调试器
To test whether a given UI is overstressing the GPU, Xcode’s built-in GPU diagnostics tools can be employed. First, configure the project in question to use Metal or OpenGLES3, then make a build and open the resulting Xcode project. Some Xcode version and device combinaisons may support OpenGLES 2 frame captures, but there’s no guarantee it will work.
为了测试给定的UI是否过度使用GPU,可以使用Xcode的内置GPU诊断工具。首先,配置项目以使用Metal或OpenGLES3,然后进行编译并打开生成的Xcode项目。一些Xcode版本和设备组合可能支持OpenGLES 2帧捕获,但不能保证它可以工作。
Note: On some versions of Xcode, it is necessary to select the appropriate Graphics API in the Build Scheme in order to make the graphics profiler work. To do this, go to the Product menu in Xcode, expand the Scheme menu item, and choose Edit Scheme.... Select the Run target and go to the Options tab. Change the GPU Frame Capture option to match the API used by your project. Assuming the Unity project is set up to automatically select a graphics API, then most modern iPads will default to using Metal. If in doubt, start the project and look at the debug logs in Xcode. One of the early lines should indicate which rendering path (Metal, GLES3 or GLES2) is being initialized.
注意:在某些版本的Xcode中,有必要在编译方案中选择适当的Graphics API,以使图形分析器工作。为此,请转到Xcode中的“产品”菜单,展开“方案”菜单项,然后选择“编辑方案”....选择“运行目标”并转到“选项”选项卡。更改GPU Frame Capture选项以匹配项目使用的API。假设Unity项目设置为自动选择图形API,那么大多数现代iPad将默认使用Metal。如果有疑问,请启动项目并查看Xcode中的调试日志。早期行之一应指示正在初始化哪个渲染路径(Metal,GLES3或GLES2)。
Build and run the project on an iOS device. The GPU profiler can be found by showing the Debug pane in Xcode’s Navigator sidebar, and clicking on the FPS entry.
在iOS设备上编译并运行项目。通过在Xcode的Navigator侧栏中显示Debug窗格,然后单击FPS条目,可以找到GPU Profiler。
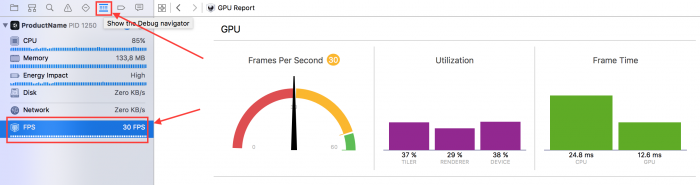
The first point of interest in the GPU profiler is the set of three bars in the center of the screen, labeled “Tiler”, “Renderer”, and “Device”. Of these two:
GPU分析器最大的好处是在屏幕中央有三个条状图,标记为“Tiler”,“Renderer”和“Device”。这两个:
● “Tiler” is generally a measure of how stressed the GPU is by processing geometry, which includes time spent in vertex shaders. Generally, a high “Tiler” usage indicates either excessively slow vertex shaders or an excessive number of vertices being drawn.
“Tiler”通常是通过处理几何图形来衡量GPU的压力,其中包括在顶点着色器中花费的时间。通常,高“Tiler”用法表示要求过慢的顶点着色器或绘制过多的顶点。
● “Renderer” is generally a measure of how stressed the GPU’s pixel pipelines are. Generally, high “Renderer” usage indicates that an application is exceeding the maximum fill-rate of the GPU, or has inefficient fragment shaders.
“Renderer”通常衡量GPU的像素管道的压力。通常,高“Renderer”用法表示应用程序超过GPU的最大填充率,或者具有低效的片段着色器。
● “Device” is a composite measure of overall GPU usage, which includes both “Tiler” and “Renderer” performance. It can generally be ignored, as it will roughly track the higher of the “Tiler” or “Renderer” measurements.
“Device”是整体GPU使用情况的综合衡量标准,包括“Tiler”和“Renderer”性能。它通常可以忽略,因为它将粗略地跟踪“Tiler”或“Renderer”测量值中的较高者。
For more information on Xcode’s GPU profiler, see this documentation article.
有关Xcode的GPU分析器的更多信息,请参阅这篇文章。
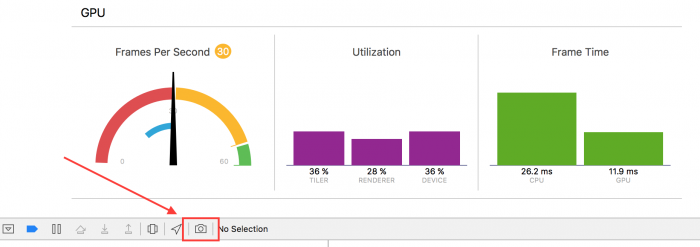
Xcode’s Frame Debugger can be triggered by clicking on the small ‘Camera’ icon hidden at the bottom of the GPU profiler. It is highlighted by an arrow and a red box in the following screenshot.
可以通过单击隐藏在GPU探查器底部的小“相机”图标来触发Xcode的帧调试器。它在以下屏幕截图中以箭头和红色框突出显示。
After a brief pause, the Frame Debugger’s summary view should appear, like so:
短暂的暂停后,Frame Debugger总结了会出现的大概内容,如下:
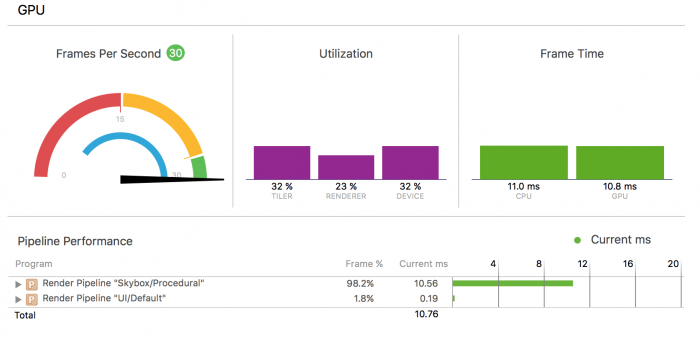
When using the default UI shader, the cost of rendering geometry generated by the Unity UI system will show up under the “UI/Default” shader pass, assuming the default UI shader has not been replaced with a custom shader. It is possible to see this default UI shader in the above screenshot as Render Pipeline “UI/Default.”
使用默认UI着色器时,Unity UI系统生成的渲染几何图形的成本将显示在“UI/Default”着色器上,假设默认的UI着色器还没有替换为自定义着色器。可以在上面的屏幕截图中看到此默认UI着色器为Render Pipeline “UI/Default.”。
Unity UI only generates quads and so the vertex shader is unlikely to stress the tiler pipeline of the GPU. Any problems that appear in this shader pass are likely due to fill-rate issues.
Unity UI仅生成四边形,因此顶点着色器不会使GPU的Tiler管道有压力。此着色器过程中出现的任何问题都可能是由于填充率问题。
Analyzing profiler results
分析分析器的结果
After gathering profiling data, several conclusions might be drawn. If Canvas.BuildBatch or Canvas::UpdateBatches seems to be using an excessive amount of CPU time, then the likely problem is an excessive number of Canvas Renderer components on a single Canvas. See the Splitting Canvases section of the Canvas chapter.
收集分析数据后,可能会得出几个结论。如果Canvas.BuildBatch或Canvas :: UpdateBatches使用了过多的CPU时间,那么可能的问题是单个Canvas上的Canvas Renderer组件数量过多。请参阅Canvas章节中的Splitting Canvases部分。
If an excessive amount of time is spent drawing the UI on the GPU, and the frame debugger indicates that the fragment shader pipeline is the bottleneck, then the UI is likely exceeding the pixel fill rate which the GPU is capable of. The most likely cause is excessive UI overdraw. See the Remediating fill-rate issues section of the Fill-rate, Canvases and input chapter.
如果花费过多的时间在GPU上绘制UI,并且帧调试器指示片段着色器管线是瓶颈,则UI可能超过GPU能够的像素填充率。最可能的原因是过多的UI透支。请参阅Fill-rate, Canvases and input章节中的Remediating fill-rate issues部分。
If Graphic Rebuilds are using excessive CPU, as seen by a large portion of CPU time going to Canvas.SendWillRenderCanvases or Canvas::SendWillRenderCanvases, then deeper analysis is needed. Some portion of the Graphic Rebuild process is likely responsible.
如果图形重建使用过多的CPU,如大部分CPU时间用于Canvas.SendWillRenderCanvases或Canvas::SendWillRenderCanvases,则需要进行更深入的分析。图形重建过程的某些部分可能是负责任的。
In the case that a large portion of WillRenderCanvas is spent inside IndexedSet_Sort or CanvasUpdateRegistry_SortLayoutList, then time is being spent sorting the list of dirty Layout components. Consider reducing the number of Layout components on the Canvas. See Replacing layouts with RectTransforms and Splitting Canvases sections for possible remediations.
在大部分的情况下WillRenderCanvas花费很多在IndexedSet_Sort或CanvasUpdateRegistry_SortLayoutList,则时间被消耗在排序被标记为dirty的布局组件列表上。考虑减少画布上的布局组件数量。请参阅Replacing layouts with RectTransforms和Splitting Canvases部分替换布局以获取可能的补救措施。
If excessive time seems to be spent in Text_OnPopulateMesh, then the culprit is simply the generation of text meshes. See the Best Fit and Disabling Canvases sections for possible remediations, and consider the advice inside Splitting Canvases if much of the text being rebuilt is not actually having its underlying string data changed.
如果在Text_OnPopulateMesh中花费了过多的时间,那么罪魁祸首就是生成文本网格。请参阅Best Fit 和Disabling Canvases部分以获取可能的补救措施,如果正在重建的大部分文本实际上没有更改其基础字符串数据,请考虑Splitting Canvases内的建议。
If time is spent inside Shadow_ModifyMesh or Outline_ModifyMesh (or any other implementation of ModifyMesh), then the problem is excessive time spent calculating mesh modifiers. Consider removing these components and achieving their visual effect via static images.
如果时间花在内部的Shadow_ModifyMesh或Outline_ModifyMesh(或任何其他实施ModifyMesh),则问题是过多时间花费在计算网格修改上。考虑删除这些组件并通过静态图像实现其视觉效果。
If there is no particular hotspot within Canvas.SendWillRenderCanvases, or it appears to be running every frame, then the problem is likely that dynamic elements have been grouped together with static elements and are forcing the entire Canvas to rebuild too frequently. See the Splitting Canvases section.
如果Canvas.SendWillRenderCanvases中没有特定的热点,或者它似乎在每一帧都运行,那么问题很可能是动态元素已经与静态元素组合在一起,并且迫使整个Canvas过于频繁地重建。请参阅Splitting Canvases部分。